All Posts By

spiv

Analytics for Customer Experience

AI-powered Analytics for Customer Experience

Up Your Game with Analytics for Customer Experience:

6 Simple Steps for Finding and Executing on Your Key Drivers of Customer Experience

Understanding customer experience seems to be easy at first glance. Just ask your customers what they care about and then improve what’s bugging them. Oh boy. Life would be beautiful if it would be so straight forward. Before harvesting God wanted us to do analytics for customer experience 🙂

Do your customers have the opportunity to speak about what is on their mind? Or do you force them into the corset of your predesigned questionnaire? Do they? That’s great.

If you are advanced in your CX processes your are probably routing every single voice raised to the frontline.But do you also quantify all structurally raised opinions into well-defined specific and actionable theme categories? Awesome, even better.

Question: How you do this?

How you do the categorization with humans manually coding every of ten-thousands of verbatims? Lucky you that you got such a large budget. However, how do you know that they do it right? If you are satisfied with the quality, do you also like the time stretch it comes with?

Now, how do you use the information, right? Are the most frequently raise issues the top drivers of your CX? How do you know? Think twice.

Aah, you are using Key Driver Analysis as analytics for customer experience. You are even more advanced! However, have you ever thought about why its explanation power (R2) is so dammed low? There is a frightening reason you should know about.

CX Pros have gone thru most of those thought processes as we did. We spend the last two years pioneering a step-by-step approach together with lead clients like Microsoft, Sonos, or T-Mobile that describes well six simple stages to most effectively driving impact with customer feedback.

STEP 1: Customer Experience Means To Listen

That’s easy. Be sure to ask open-ended questions. Customers love this; it gives the most unbiased information and provides the possibility to collect much more feedback as questionnaires are very short. NPS earned its success for a reason.

However, feel free to adopt the rating question to your needs. Don’t care about benchmarking. With this process, you can free yourself from questionable industry benchmarking.

STEP 2: Listening at Scale … Requires AI

Most customer text feedback is not read or appropriately processed. This is an assault to customers. We owe this to our customers AND our shareholders. Those pioneers of you, that from early on experimented with text analytics an NLP software might be today disillusioned.

Indeed existing out of the box system do not provide very actionable categorizations. Even worse, we tested the predictive value of the output of such systems and found them to be vastly inferior to human coding.

So, no way around human coding? Besides the fact that most companies can’t effort the costs or the time needed to code all unstructured customer feedback fully, it turns out that even this can be entirely erroneous and inconsistent. While coders in scientific studies can code consistently about 80% of verbatims, real worlds coders often do not exceed 60%.

Luckily there is a today underleveraged breed of technology that we found to be able to outperform humans and conventional text analytics machines alike. It is underleveraged because it is this kind of deep learning AI that needs to be trained specific towards the domain, context, and question posed.

STEP 3 – Understanding The Unsaid, Understanding Hidden Motives … Requires AI

Unfortunately, the journey does not end in quantifying what customers are saying. The reason is simple. Some do point to issues that are just on top of their mind. What clients do not tell us is how significant the impact to its satisfaction and loyalty is when you fix the issue. They don’t tell you because of 1. You did not ask, and 2. They probably will not be able to seize it.

Key Driver Analysis (KDA) is needed as analytics for customer experience. However, it turns out that those techniques explain mostly far below 50% of the explained variance. Too low to be confident about its recommendations. There is an uncomfortable reason.

Those conventional statistical methods are about 100 years old (Recently read how Unilever leveraged them in 1919 to optimize Marketing). The drawbacks are several and summarized in three simple points:

Three drawback of conventional statistics (KDA)

  • KDA assumes all themes, topic, and issues to have an independent impact on CX. However, an extremely friendly waitress that notoriously pores its hair into your soup will not win a CX award. Sometimes the best service cant makes immense when some fundamental factors are not met.
  • KDA assumes the more, the better. We see, e.g., for the Sentiment score of a verbatim that its effects are highly nonlinear. In other words, the negative tone indicates much more (negative impact) that a positive tone.
  • KDA assumes all themes to be on an equal level and does not influence each other. However, if someone mentions “Great service” and “friendly staff” that latter most probably driving the first, by not capturing these effects, results will be primarily screwed and hard to interpret.

So what’re the solutions? Yes, it’s AI. Machine learning can flexibly adapt to data without relying on unrealistic assumptions. Success Drivers pioneered in 2001 causal machine learning – we call it now Causal AI. It explains, on average, by factor 2, better why customers are loyal, and others don’t. Thats analytics for customer experience of the next generation.

STEP 4: Driving Impact … Requires Linkage to the Frontline

Typically analyst overemphasizes the important of insights. Sure it is important, but the ultimate goal is to drive effective actions.

Therefore the first and most important use of customer feedback is to route it back to the frontline. Nevertheless, it is often overlooked that the frontline needs guidance on how to interpret comments and to understand the priority and importance of raised topics.

This is where the results of the AI-powered Key Driver Analysis comes into play. Customer service personal will instinctively work on those topics that will be most often mentioned. They will try to be aware of the negative and try to maintain the positive.

Still what AI taught us, is that frequency and importance of raised topic are mostly unrelated. To be effective and interpret customer feedback correctly ALSO the frontline needs to know what’s important and which theme is instead mentioned as a top-of-mind association.

STEP 5: Driving Impact … Requires Linkage to the C-Suite

On top of that, many issues can’t be solved by the frontline. Sometimes it needs initiatives, infrastructure, training, investments. This is where the explanatory power of AI enfolds its full use. Now it is possible to plan actions and associated investments and simulate the actual impact on CX and resulting profits.

Let me ask you a question: Why is the finance department so powerful, much more powerful than CX? Does it bring in clients? Alternatively, does it invent new products? Maybe it does produce revenue? In fact, to every business, the finance team is a cost. Still, it has the CEO’s ear. Why? Because finance leaders create something incredibly powerful: TRANSPARENCY.

The lack of transparency in CX leadership is called – the Power Gap. If you create transparency, you have the power to move the organization.

Companies are catching up by making CX status across touchpoints, channels, segments, and business units transparent. However, why does close to every organization fails is to create transparency in what truly matters – in understanding what is the key lever to bring customer experience to the next level? AI can generate this transparency and thus to provide true power to CX leaders.

STEP 6: Gain Trust and Alignment … by Leveraging the Predictive Power of AI

The second gap when it comes to driving impact is the “Trust Gap”. When CFOs explain that cutting 10% costs, it’s entirely trustworthy that profits will – at least short-term- dramatically improve.

However, Marketing and Sales are handicapped. There is this “creepy unknown creature” called “customer,” which is less manageable as the internal processes. Even worse, other “magic forces” called “competition” is trying to attack us.

All this seems to be nebulous to many CEO’s. There is a Trust Gap. Marketer too often defends themselves with beautiful stories that too often proofed to not convert into reality.

What if you would have a tool that allows you to predict outcomes of actions? Sure, some would be skeptical. SONOS still dared to use it. They made predictions and implemented measures.

It turned out that predictions had been spot on. If predictions suddenly turn reality, prediction giver becomes “prophets”. If you can prove that your system has validity, you gain trust. Trust is truly needed to turn valuable insights into actions.

Are you ready to take actions? Then you should take a look at CX-AI.com!

The 2 Powers of CX Leaders

The 2 Powers of CX

Why is the finance department so powerful, much more powerful than CX? Does it bring in clients? Or does it invent new products? Maybe it does produce revenue? In fact, to every business, the finance team is a cost. Still, it has the CEO’s ear. Why? Because finance leaders create something incredibly powerful: transparency.

Who has this week’s highest sales? Which department overspending the budget?  Finance knows. And that’s why, when finance calls, every CEO listens.

The power of finance holds important lessons for change leaders. Making improvements happen can be tough though, whether it’s customer service, IT tools, HR processes. And often you won’t have the power to drive change on your own.

Learn from finance. Use the power of transparency. Imagine you want to improve the customer experience. What if, each month, you could put a simple chart in front of the CEO showing how customers rate every department, every touchpoint, every product of your firm? In the top left corner, those who get the highest ratings. In the middle, those who do ‘okay’. In the bottom right-hand corner, those with the poorest customer ratings. Would your CEO want to see this chart? You bet. Would such a chart give you power? You bet. Why? Because no department leader wants to stay in the bottom right-hand corner. This is one of the twin powers

Still this is not enough

But will the poorly rated departments automatically improve? Think twice.

Of cause not. Those departments do seldom lack motivation or diligence. They lack in knowledge about which core initiatives will truly boost CX performance. Therefore, to make change happen, shed light on the issue. Measure customer feedback. But most importantly, make sure you understand which hidden forces drive success.

The greatest illusion in management is those about the validity of its own judgment and the believe that a simple look at data give clarity about the root causes. I wrote a book about this (amazon). Luckily, our AI age brought up proven tools for managers (such as CX.AI). Like physicians, they now also have X-ray machine enabling evidence-based judgement.

You want C-Suite to listen when the CX leader calls? Use the power of transparency. If you further want to up your CX game? Bring transparency to what drives outcomes.

– Frank

p.s. the whole background is well discussed in this Webinar Recording “How to make change in CX happen why AI plays a crucial role” with worlds #1 Customer Leadership Thinker Thomas Barta and myself.

6 Ways to Get More From Open-Ends

6 ways to get more from open-ends 

How to elicit more detail from open-ends in your CX measurement

by Frank Buckler

It is a big challenge– most customers do not write much feedback when questioned about their experience with a product or brand in open-ends. In CX-surveys that are not tied to specific touchpoints, customers will often write nothing. What can we do about it?

1. Do telephone interviews

Phone interviews are a remedy for two diseases. They deliver much higher response rates and result in more comprehensive feedback to open-ended questions. No medicine without side effects: Typically, interviewers interpret feedback in imprecise and subjective ways. Additionally, customers feel under pressure to say “something.” The social pressure of responding to questions from another human being can introduce bias and result in misleading findings.

2. Force answers

Most companies will stick with online surveys simply for cost reasons. Some brands use a simple trick. They force customers to write something. Admittedly, some customers write NA, no comment, or just nonsense. However, it does produce results and generates customer feedback. However, customers will still tend to offer brief answers.

3. Assess a predefined tree of reasons first

Let’s face it. Customer feedback will generally result in 20 to 40 different topics. Why not present the top five themes (from historical results) in a survey and let customers make a simple choice between a small list of reasons? We have analyzed such data and found, as always, pros and cons. Yes, you get nearly 100% response. At the same time, you lose more than half of your open-end feedback. Overall, you lose granularity and win answer rates. Still, what are those closed-ended answers telling you? Does an aided answer have the same meaning as an unaided?

4. Ask better questions

A technique that typically helps to improve feedback in open-ends is to phrase your question well. Ask for help, ask politely, but still urge customers to answer. Most people are polite and feel some obligation to give more efforts.

5. Ask another question

“Different questions different answers” that is an obvious fact. So why not ask another question. The following question does work well for businesses with a high volume of customer interactions “Can you tell us about an experience you had that illustrates why you gave this answer?” Of course, this adds more time and effort to the customer. However, our research shows, that customers love open ends. They love to have the possibility to use their own words.

6. Be responsive with chatbots

Instead of asking a fixed question, we have found that you get more feedback if customers have the impression that follow-up or subsequent questions are based on prior feedback. It evokes more granular feedback if a chatbot responds to a positive but quite short comment, “Happy to hear that. Could you tell me a bit more about it?”
 or that it was negative and the answer long “I’m sorry to hear this. Thanks for the detailed answer. Anything else we should know?”.

Our CX.AI chatbot performs all of these functions. It injects a pinch of “social” pressure without bias. As a result, we get much more granular feedback.

The CX.AI advanced chatbot goes the extra mile as it understands the content topics mentioned in the text in real-time and has predefined probing questions for each of them. The chatbot does not just produce more granular answers. It enables us to model detailed causal trees. If the bot understands “Great service” and asks for details, we can then learn exactly what makes a service great. If it understands “Trustworthiness,” we can understand what exactly makes customers trust you.

So, how can we make your customers answer more in your CX measurement open-ends? We discussed several options, and one thing became apparent: It is the wrong question. It is not enough to just generate more data. The ultimate objective is to learn what moves or stops your customers. What makes them become fans or haters? The desired insight is buried in the customer feedback and underneath several unavoidable biases that were discussed.

You can only uncover those insights when letting an AI find the causal link to your customer experience measure. That’s why we developed CX.AI – a platform built to understand what’s really driving customer perception and behavior. More on www.cx-ai.com

Is CX Dying?

Is CX Dying? 

The Key to Saving Customer Experience at Your Organization

by Frank Buckler

I recently read two pieces of research about Customer Experience that greatly worried me. The first was from Nunwood, who publish a Customer Experience index, and it showed that improvements in Customer Experience were not happening. The second was from Forrester, echoing a similar finding: no increases in Customer Experience improvements.

With all the effort that companies are putting into improving their Customer Experience (CX): Why are there no measurable improvements? The C-Suite want to see a return. If this continues, I am sure the investment in people and money dedicated to the effort will stop—and rightly so. However, if that happens, I worry that Customer Experience as a movement will die.

Although there are many reasons for this from my experience, one central mistake is made in nearly every CX initiative. It is something many have already recognized. Prof. Fred Reichheld (Co-developer of NPS) talks precisely about this in a recent keynote:

“Be aware of interpreting what customers tell you when you ask them for the reasons about their likelihood to recommend. It does not all have the same importance in driving loyalty.”

Nicely said. However, this is not very useful if you do not have a way to identify what actually is important in driving CX and loyalty! We need a way to differentiate between essential reasons and responses that are only top of mind.

This is the Mission behind CX.AI – a platform that automatically codes open-end responses with human-like precision. It then leverages causal AI to identify the Loyalty impact of themes mentioned by customers.

What we see in most cases is that the most often mentioned reasons for LTR generally have low to moderate impact. If they happen to be important, they tend to be quite general topics: “good personal service” instead of “they react fast” or “they are honest and trustworthy.”

Sure, one of the most powerful CX management tools is to give customer feedback directly to the frontline. But even better is to provide insights from the customer feedback. Insights that prioritize true loyalty drivers and enable your service representatives and account managers to engage with customers armed with information that better serves customer needs and accelerates the resolution of dissatisfaction. They need information about which topics are most severe and urgently need to be addressed before losing a customer.

Is CX dying? Those companies who understand the value of analyzing and interpreting customer feedback AT SCALE using available natural language processing (NLP) and AI technologies will soon become the lighthouses of the CX movement and elevate it to the next level.

Here is more on the CX.AI solution www.cx-ai.com

How to create a truly enjoyable survey …

How to create a truly enjoyable survey… 

and why this is the key to get deeper and more actionable insights.

Do you remember those hot days in the summer of 2018? At one of those days, we were about to launch a mobile survey with 16 questions, 8 of them being open-ended. My colleague David, who were sweating next to me, said “This will never work! Who wants to respond to 8 open-ended question, on a mobile phone?”. Still, we had no other choice. We even added two more questions, “did you enjoyed this survey?” and “why did you answered this way?”

The outcome was a surprise. On average, about 50% of respondents in conventional surveys indicate they enjoyed the survey. Our mobile survey achieved a 91% enjoyment rate. Wow!

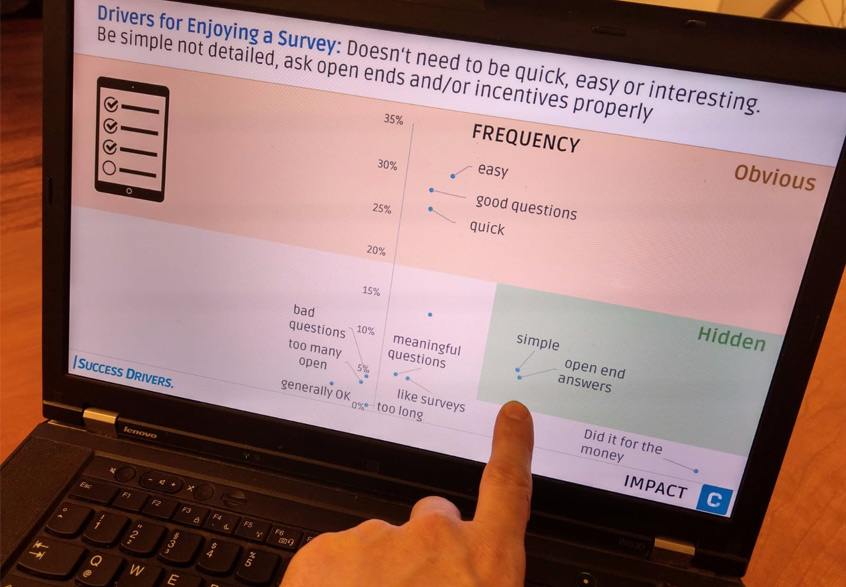
You will ask yourself “why?”. This is exactly what we asked the respondents. The most frequently mentioned reasons were “it was easy”, “these were good questions” and “it was fast”. (actually, the average time was 5 minutes, which is a rather long response period on a mobile phone).

Are you satisfied with these answers? We took them to the test. If a reason is a true reason, it must be possible to use its information to better predict the enjoyment rating (in a multivariate model). This is a ground-truth formulated by the fathers of causality research such as Nobel Prize winner Clive Granger.

This is why we build a flexible (machine learning based) prediction model and discover something quite exciting. None of the frequently mentioned reasons predicts well why respondents enjoyed the survey. Instead, two other reasons are highly predictive.

The text response “the survey was simple” was mentioned by 10% of respondents and was a strong predictor of survey enjoyment. Further, text that can be summarized as “i liked the opportunity to describe my sentiments with my own words” was mentioned by 9% and is an even stronger predictor.

Recent attempts to increase respondents’ engagement in the industry typically circle around varied and entertaining ways of surveying and to use more gamification approaches. But what we now learned is that the key is less about building more sophisticated ways of asking, it is more about to keep it really simple and give respondents the option to communicate in the most authentic way possible: to use their own words.

You may ask “ok, but is coding open-text responses economically even feasible and attractive?” Recent technologies that combine Natural Language Processing and Machine Learning can automatically code large volume of text. The system we use must be trained by a human coder. Then its output has comparable predictive power with human codings.

“Ok, but what does this mean for improving the quality of insights?” you might ask yourself
. good question!

Let’s look at what we have learned. We have learned that we receive the most authentic and high quality information from respondents (e.g. your customers) by asking very simple questions and let people respond in their own words. At the same time, we now have the technology to discover hidden drivers of success in those simple text responses.

Of course, we can not only learn what is truly enjoyable with surveys, we also can learn why customers are loyal or more likely to recommend your brand. We can also learn why they consider certain brands or choose a new product innovation.

We can learn valuable insights that are key to success by using extremely simple and cost effective research methods. What could be more exciting?

If you like to dive deeper 
 e.g. how to make this work for your NPS program, your Brand Tracking study or whatever you think drives value in your company, just let me know and I’ll be happy to chat.

Yours, Frank

Why customer join, is not why they stay: Artificial intelligence reveals the key loyalty drivers for mobile provider

Why customer join, is not why they stay: Artificial intelligence reveals the key loyalty drivers for mobile provider 

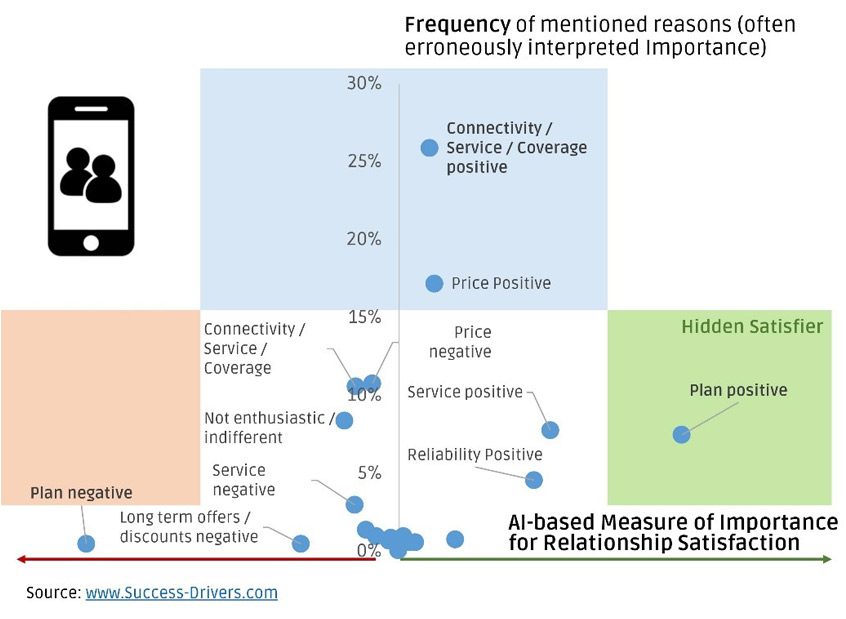
Mobile customers may choose a carrier because of a proper connectivity. Interestingly this reason is not the most important for their loyalty and why customers recommend their carrier to others. Instead, the key driver of customer loyalty and recommendations are attractive plans. This is a core finding from Success Drivers’ recent category CX study.

The results exemplify the power of the company’s solutions to reveal hidden drivers of customer loyalty. Two research instruments, CX.AI and Brand.AI use two simple sources of information: a standardized scale to measure customer loyalty and an open text question asking “why?”. The study was done in collaboration with codit.co – an AI-powered platform for the analysis of open-ended survey questions.

“We asked 1,000 American customers: “Would you recommend your mobile carrier to a friend”. And we asked “why?” They most frequently answered “because of the good network connectivity/coverage” said Frank Buckler, CEO of Success Drivers and continues: “What we discovered is that this reason – although most mentioned – has a minor impact on customers loyalty and recommendations.”

The Success Drivers AI technology revealed the factors that were more likely to lead to carrier loyalty and recommendations. Although connectivity/coverage is known to be the one of the dominant factors why customers choose a carrier, it has only moderate impact on loyalty and recommendations. AI algorithms found that being satisfied with the actual plan is the largest reason why customers stay at a carrier and the dissatisfaction with their plan is the major reason for leaving.

The methodologies used in this study rely on coding text into content categories. The research tool is an AI-powered platform, which automatically codes text with great precision after training by human content experts. Its novel deep-learning-based engine enables fast, inexpensive and accurate analysis of large-scale open-end surveys or other text sources.

The figure below shows a more detailed picture of this study. The vertical axis is the frequency with which a loyalty factor has been mentioned, and the horizontal axis shows the impact of factors on customer loyalty. The results show the challenge of conventional survey research: customers find it difficulty in prioritizing what drives their behavior. Self-learning AI-based algorithms help finding the complex correlations between customer responses and their level of loyalty and likelihood to recommend.

CX.AI: A simpler CX platform with deeper insights

Conventional CX programs are descriptive, not predictive. They do not provide insights into why NPS score has changed or reveal the hidden, non-obvious success drivers. CX.AI’ powerful web-based dashboard shows it all: Trended NPS, our proprietary AI-powered impact of key loyalty drivers, and an explanation of the change in NPS compared with the last wave.

Established high-reputation brands like SONOS are convinced: The NPS.AI solution helps to simplify, and safe costs, and most importantly it delivers insights capable to inform top-level business decisions.

More details: http://social-ai.co